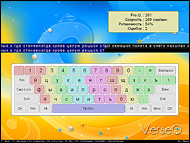
VerseQ - поразительный клавиатурный тренажер, который сделал слепую печать доступной каждому
Представьте себе, что вы садитесь за компьютер, и начинаете писать... Ваши руки порхают по клавиатуре вслед за вашими мыслями, стремительно и изящно укладывая их в аккуратные строчки. Задумайтесь буквально на секунду, будь это так, если бы вы умели печатать со скоростью мысли, как тогда много вы могли бы написать? Как много вы смогли бы рассказать и сохранить для себя и для других? Сколько теплых слов могли бы передать своим любимым и друзьям? И как много ярких мыслей и моментов своей жизни смогли бы навсегда оставить с собой?
 |
 |
Скачать |
|
Бесплатно скачайте и испытайте эффективность VerseQ! |
 |
Купить |
|
Учитесь с наслаждением и без ограничений! :) |
|
Да, понимаю, что вы пробовали учиться печатать слепым методом, что это тяжело. Но дайте себе еще один шанс - VerseQ. VerseQ создана для именно вас. Это поразительная система обучения слепой печати с невероятно простым и, в тоже время, изумительно эффективным подходом. Попробуйте, и уже сегодня, через час, вы сможете печатать вслепую. Да, пусть медленно, пусть с ошибками, но сможете. А дальше уже дело отточки мастерства. Но первый, самый важный, шаг будет уже позади. Проверьте сами. Прямо сейчас! Ведь целых 7 дней совершенно бесплатно!
В основу VerseQ заложен уникальный и невероятно мощный алгоритм обучения, который создает с обучающимся с глубокую обратную связь. И именно поэтому, только с VerseQ Вы сможете
печатать вслепую уже через час обучения, даже если раньше не могли себе этого
представить. Одна только просьба - выделите этот час, упритесь и действуйте точно по
рекомендациям.
Всего один час! После этого закрывайте тренажер, открывайте
свой любимый текстовый редактор и пишите свое первое письмо слепым методом. Да,
будет не быстро, будут ошибки, но Вы сможете! А дальше, уже тренируйтесь на повышение мастерства. А тут все уже зависит только от Ваших талантов и желания.
Лучший известный показатель – с помощью VerseQ человек научился печатать слепым методом на скорости 250 сим./мин. с нуля за полтора часа! Правда этот человек был до этого профессиональным пианистом. :) Обычно, 5-15 часов скорее всего будет достаточно.
Почему с VerseQ быстрее? Да просто потому, что VerseQ подстраивается
конкретно под Вас, под Ваш темп, под Ваши ошибки, и предлагает самый короткий
путь именно для Вас! С VerseQ Вам не
придется тратить драгоценное время на прохождение нагромождения нудных уроков,
которые были разработаны для некой «стандартной серой массы».
Благодаря
инновационному подходу к обучению слепому методу печати,
VerseQ предлагает Вам целый ряд уникальных преимуществ, которые значительно
выделяют VerseQ среди остальных тренажеров:
Эффективность
- Уже сегодня, через час Вы сможете печатать вслепую. Да, уже через час,
хоть и медленно, но уже сможете написать свое первое письмо другу слепым
методом.
- Через 5-15 часов работы с тренажером Вы сможете печатать на скорости 200-350
сим/мин.
Отсутствие избирательности
- 100% гарантия результата для любого, кто проработает с программой больше
часа, следуя рекомендациям.
- VerseQ эффективна вне зависимости от темперамента, пола и возраста обучающегося.
Психологический комфорт
- Технология обучения VerseQ исключает нервное напряжение. Наоборот, работа
с VerseQ способствует психологическому расслаблению.
- VerseQ, как и опытный преподаватель, ни в коем случае не наказывает за
ошибки, а наоборот, помогает их отработать и закрепить правильные навыки,
специальным образом составляя индивидуальные упражнения.
Независимость от уровня подготовки
- Подходит начинающим, как основной тренажер.
- Подходит продолжающим для отработки слабых мест и повышения скорости печати.
- Подходит профессионалам для поддержания формы.
- VerseQ также крайне показана всем тем, кто не смог пройти обучения на стандартных
тренажерах и застрял где-то на основном ряду. С VerseQ Вы уже сегодня сможете
печатать вслепую на скорости 70-150 сим/мин.
Нисходящая кривая сложности обучения
- В VerseQ распределение сложности обучения оптимизировано под условия индивидуального
обучения, где главную роль играет самомотивация. Поэтому в VerseQ самый сложный
этап - первый час, а дальше все легче и легче. Такое распределение сложности
позволяет эффективно использовать силу первых мотиваций человека научиться
слепой печати и не дает угаснуть ей впоследствии.
- Нисходящее распределение сложности помогает максимально быстро и без
психологических барьеров наращивать скорость печати.
Максимальное использование способностей обучающегося
- VerseQ не ограничивает ваших способностей к самообучению. Есть примеры,
когда люди с абсолютного нуля достигали скорости 150 сим/мин за час обучения.
VerseQ – это сплав современных компьютерных технологий и результат
многолетней работы по разработке и изучению эффективности адаптивной технологии
обучения с глубокой обратной связью. Многие моменты в VerseQ Вам покажутся
удивительными и спорными, но ни в коем случае не волнуйтесь – методология
VerseQ разрабатывалась и отлаживалась в течение нескольких лет, прежде чем
обрела современную форму. VerseQ и ее академическая версия KeyTO уже помогла
тысячам людей легко овладеть слепой печатью.
Но зачем Вы читаете все это? :) Вы можете прямо сейчас и совершенно бесплатно
скачать и испытать эффективность VerseQ! В течение 7 дней VerseQ полностью
функциональна! :)
С уважением,
Владимир Ким
команда VerseQ